
Microsoft has unveiled a feature summary for the December update to Power BI Desktop. The highlights this month include some amazing features and bunch of them are preview features, which are not only helpful but very promising, these include customizing & exporting current themes in Power BI, the all new decomposition tree visual with a lot of formatting options, Automatic page refresh for Direct Query details, bullet charts and much more.
New decomposition tree formatting
The formatting of new decomposition tree visual with many more formatting options this month.
The new options include.
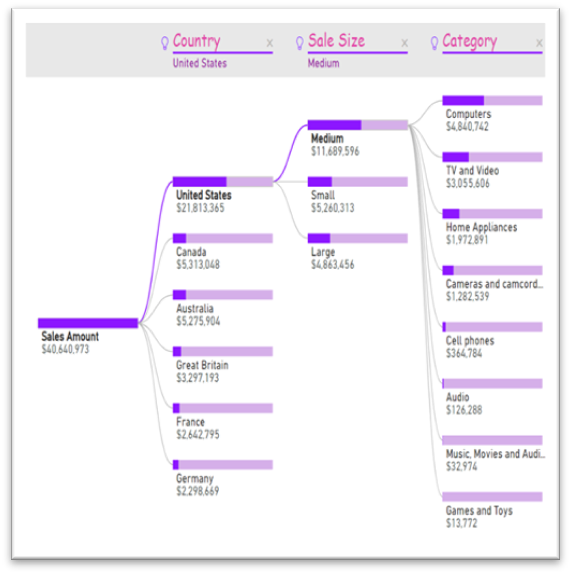
- Category labels font family, size, and colour.
- Data labels font family, size, colour, display units, and decimal places precision
- Level header title font family, size, and colour
- Show subtitles toggle
- Subtitles font family
- Level header background colour
- Data bars background colour and width
- Tree connector colour
New xViz visuals
xViz has added four new visuals to their suite. As a reminder, xViz is a package of visuals with highly advanced formatting and configuration capabilities. You can use the basic capabilities for free or purchase a license that will give you access to all the visuals for one price.
Hierarchy tree
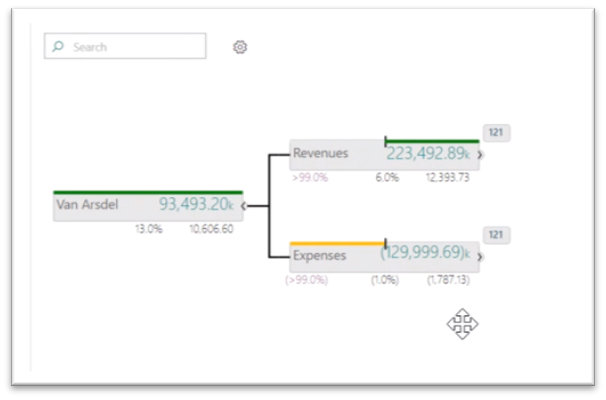
The hierarchy tree visual lets you display hierarchical data in a visually appealing tree view. This visual is similar in layout to our decomposition tree, but it allows you to compare two measures, such as budget and actual, and see the variance between them.
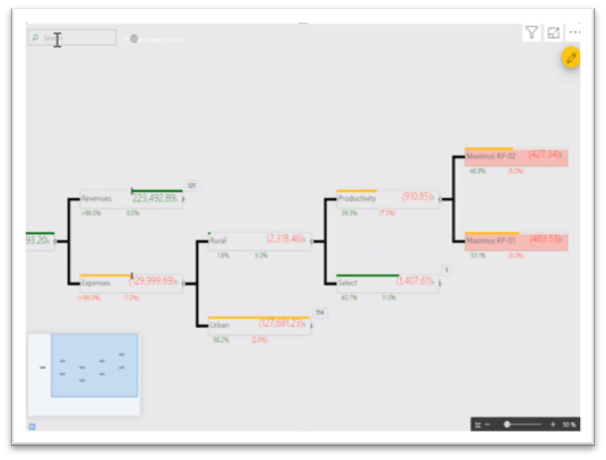
When your tree extends beyond the viewport, you can now continuously pan with zoom control and even a mini map to help you navigate.
You can also search for nodes with the search box in the top right, which helps when the tree is quite large.
Optionally, for each child you can also see the number of nodes that haven’t been expanded out. You can conditionally format the nodes based on the values displayed in them, and you can even control the look and precision of the values with advanced number and semantic formatting. The connector lines, the font formatting, and background and node colours can also be controlled through the formatting pane.
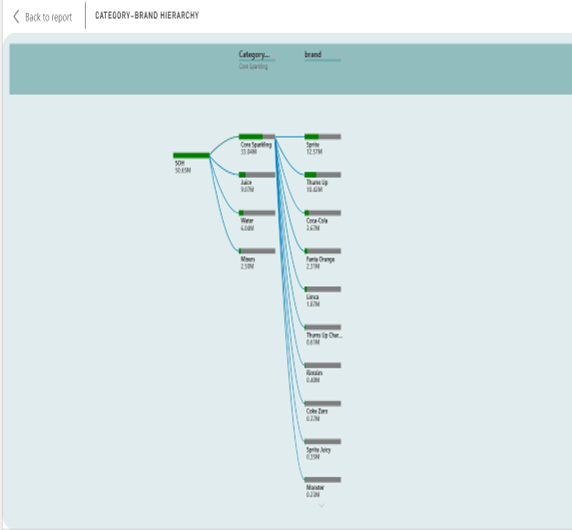
For example, we used hierarchy tree visual for stock Analysis report where it is describing about stock on hand (SOH) Metric. It is explaining both category and brand wise SOH. We are showing the particular category with brand name and SOH that we are analysing the highest and lowest SOH.
